M Aseem //
The 20 most profitable firms in India now generate 70% of the country’s profits, up from 14% thirty years ago. The rise of India’s networked economy (highways, cheap flights, broadband, GST) has allowed large, efficient firms to use superior technology & better access to capital to squash smaller competitors. In line with what is being seen in the US, the growing dominance of a handful of very large companies in India is changing the template of capitalism in India.’
While some of the Marxists in India are still endlessly debating to what extent capitalism has developed in the country and to what extent feudalism still remains, this is the conclusion of a study by investment research firm Marcellus published here https://marcellus.in/blogs/behold-the-leviathan-the-remaking-of-indian-capitalism/ It further says that like other developed capitalist countries whose economies have formalised, the profit share of the top 20 Profit After Tax (PAT) generators in India will also continue to increase from the current 70% to 80-90%. Similar is the position of concentration of capital in industries where monopolies/duopolies have become fully entrenched. The blood bath has taken place not only in prominent sectors like Telecom, but also in many other industrial sectors.
“India is already an economy with extraordinary levels of profit share concentration in many key sectors. For example, in paints (Asian Paints, Berger Paints), premium cooking oil (Marico, Adani), biscuits (Britannia, Parle), hair oil (Marico, Bajaj Corp), infant milk powder (Nestle), cigarettes (ITC), adhesives (Pidilite), waterproofing (Pidilite again), trucks (Tata Motors, Ashok Leyland), small cars (Maruti, Hyundai) we already have one or two companies accounting for 80% of the profits generated in the sector. Now this trend looks likely to spread to more fragmented sectors where hitherto the unorganised players had greater profit share.”
On examining how the profit share of the top Indian companies has fared in the post-1991 era, below is the picture that emerged.
Exhibit 1: “The vertical axis of the chart represents the 3-year moving average of the ratio of the amount of profit generated by 20 most profitable listed companies in India divided by the total profit generated by the entire Indian corporate sector. As the chart above shows, from around 14% when the country was opened up in the early 1990s, India’s top 20 PAT generators now account for nearly 70% of the profits generated in the world’s sixth largest economy.”
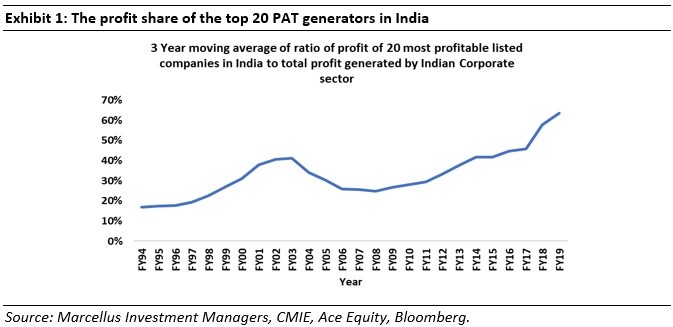
Exhibit 2: “Since GDP is simply the aggregate of the returns to land, labour & capital, we then looked at what % of Indian GDP is accounted for by the PAT of the top 20 companies. In the above chart, the left axis is the same as Exhibit 1 and the right axis shows the PAT of the top 20 companies divided by India’s Nominal GDP. Although the share of top 20 companies in Total PAT has increased significantly (LHS) from FY08, their PAT as a % of GDP (RHS) has declined during the same period. In fact, for the entirety of the 21st century, the two lines in Exhibit 2 have moved in opposite directions.”

So Why Are The Largest Indian Firms Becoming Utterly Dominant Leviathans?
According to this research, there are four main reasons for this to happen (material below are slightly adapted in my words, not verbatim quotes).
- A networked economy helps more efficient bigger companies: Over the past ten years, the length of roads in India has increased from 3.3 million km to 5.9 million km (CAGR of 6%). The number of mobile phone subscribers has increased over the same period from 392 million to 1161 million (CAGR of 12%). The number of broadband users has increased from 6 million to 563 million (CAGR of 57%). A decade ago, around 44 million Indians were taking flights each year. Now 3x as many Indians are flying each year (CAGR of 13%). 15 years ago, only 1 in 3 Indian families had a bank account; now nearly all Indian families have a bank account.
As a result of this networking of the Indian economy, the companies able to invest more in constant capital have benefited in competition. Larger more capital-intensive efficient companies with strong distribution systems have pulled away from regional & local players. For example, as the economy gets integrated, lending, which was once dominated by regional players is now seeing the emergence of a few national leviathans like HDFC Bank and HDFC with both lenders entering the list of top 20 PAT generators over the last 10 years.
2. Regulatory burden is higher for smaller companies: Economists have long believed that onerous regulatory regimes hurt smaller companies more than larger ones. Clearly, smaller players, with limited resources, must spend relatively more resources than the larger ones. Similarly, the cost of adapting to GST was negligible for a leviathan like Asian Paints but far more significant for a smaller paint company with a fraction of Asian Paints’ market share.
This is what I have been arguing since long, policies like GST and accelerated formalisation in the economy through various measures like cashless and digital after forced demonetisation have been to the benefit of the larger monopoly capital. Whatever, the results of these policies for the economy as a whole and common people in general, these have benefited largest capitalists to certain extent, hence Modi continues to retain their support.
3. Technology as a barrier to entry: As per a March 2019 survey conducted by McKinsey, smaller Indian companies have adopted the system of accepting digital payments more than the larger companies. However, they just do not have the resources for advanced technologies such as artificial intelligence and the Internet of Things. This is where the larger companies score over the smaller companies. We find that in businesses where pan-India distribution/presence is required, market leaders like Asian Paints, HDFC Bank, Astral Poly, Pidilite, Page Industries, etc. have made skilful use of technology to build barriers to entry. For example, it is highly unlikely that any paint company will be able to build an Enterprise Resource Planning system remotely comparable to what Asian Paints has. Hence Asian Paints’ working capital cycle at 8 days will remain a massive source of superior cashflows whilst its competitors continue to live with working capital cycles in excess of 100 days.
4. Lower cost of capital for the giants: India’s top 20 PAT generators fall into two broad buckets: (a) private sector companies which have superior free cash flow generation thanks to their Return on Equity (ROE) being significantly above their cost of equity eg. HDFC Bank, ITC, HDFC, TCS, etc; and (b) giant PSUs which get access to capital at a low cost because of their implicit sovereign guarantee. Smaller companies have access to neither source of capital. This in turn all but eliminates their chances of being able to compete with these leviathans. For example, ITC has over Rs 28K crore of cash on its balance sheet. In addition, ITC generates Rs 10K of free cashflow in a typical year. For any FMCG firm which isn’t a leviathan, competing with ITC’s cash machine is a difficult proposition.
Writing this piece very quickly owing to short time available I will restrict myself to draw 3 main quick conclusions from it from a Marxist point of view:
- Concentration and monopolisation in India have been increasing at an accelerated pace since the neo-liberal policies were implemented as firms have increased their organic composition of capital, i.e., higher constant capital (machinery, technology, etc) vis-à-vis variable capital (labour power employed). This has intensified competition, benefited the capitalist with access to more capital through capital markets or capital loaned by financial capitalists. On the other hand, it has driven away many smaller firms from the market resulting in huge number of bankruptcies to such an extent that Indian capitalist state had to come up with a formal legal mechanism to handle it through Indian Bankruptcy Code (IBC) mechanism.
- However, as predicted by Marx, the higher organic composition of capital also triggers the rate of profit to fall. As variable capital per unit of production is reduced, the surplus vale embedded in produced commodities also goes down though this tendency is counteracted upon by various other factors like intensification of the rate of exploitation of labour. This is clear from Exhibit 2 which show that despite the total share of profit increasing for the largest firms their profit as share of India’s Nominal GDP has fallen to just above 1.5% after reaching a peak of nearly 3% in years 2008-09. This is what I have been arguing is the major reason for the economic crisis in India, since this rate of profit has fallen quite drastically for rest of the firms and they are unable to repay interest on the capital loaned to them by banks, resulting in crisis in financial sector getting burdened by high amounts of non-performing assets. That is also the reason for continued demand by capitalist class to lower interest rates in the economy and removal of RBI governors Rajan and Patel as they didn’t agree to it as the they aimed monetary policy to control rate of inflation.
- This falling rate of profit has been the main driver for Indian capitalist class to opt for a full-fledged fascist alternative after 2010. This is forcing them to continuously intensify the rate of exploitation of labour, not only increasing relative surplus value but also absolute surplus value (as seen from the moves to increase the length of working day). This intensification of rate of exploitation is difficult to be done within even the formal bourgeois democracy and a fascist government suppressing all working class organisations and movements becomes the preferred alternative especially in a country like India where there is enough backward social-cultural environment for that to grow and consolidate upon.
Originally published in The Truth: Platform for Radical Voices of The Working Class (Issue 2/ June ’20)
